> ## Documentation Index
> Fetch the complete documentation index at: https://docs.yambr.com/llms.txt
> Use this file to discover all available pages before exploring further.
# 3. Marketing budget tracker (Excel)
> A two-sheet Excel workbook with live formulas, conditional formatting, and a Planned-vs-Actual bar chart — generated by the xlsx skill.
Spreadsheets are where a lot of "AI-generated content" demos quietly fall apart. The model produces a table that *looks* right, but the formulas are dead text and the chart is a screenshot. The `xlsx` skill removes both problems: every formula is live, the chart is a real chart object, and conditional formatting survives the round-trip into Excel or Google Sheets.
## The prompt
```text theme={null}
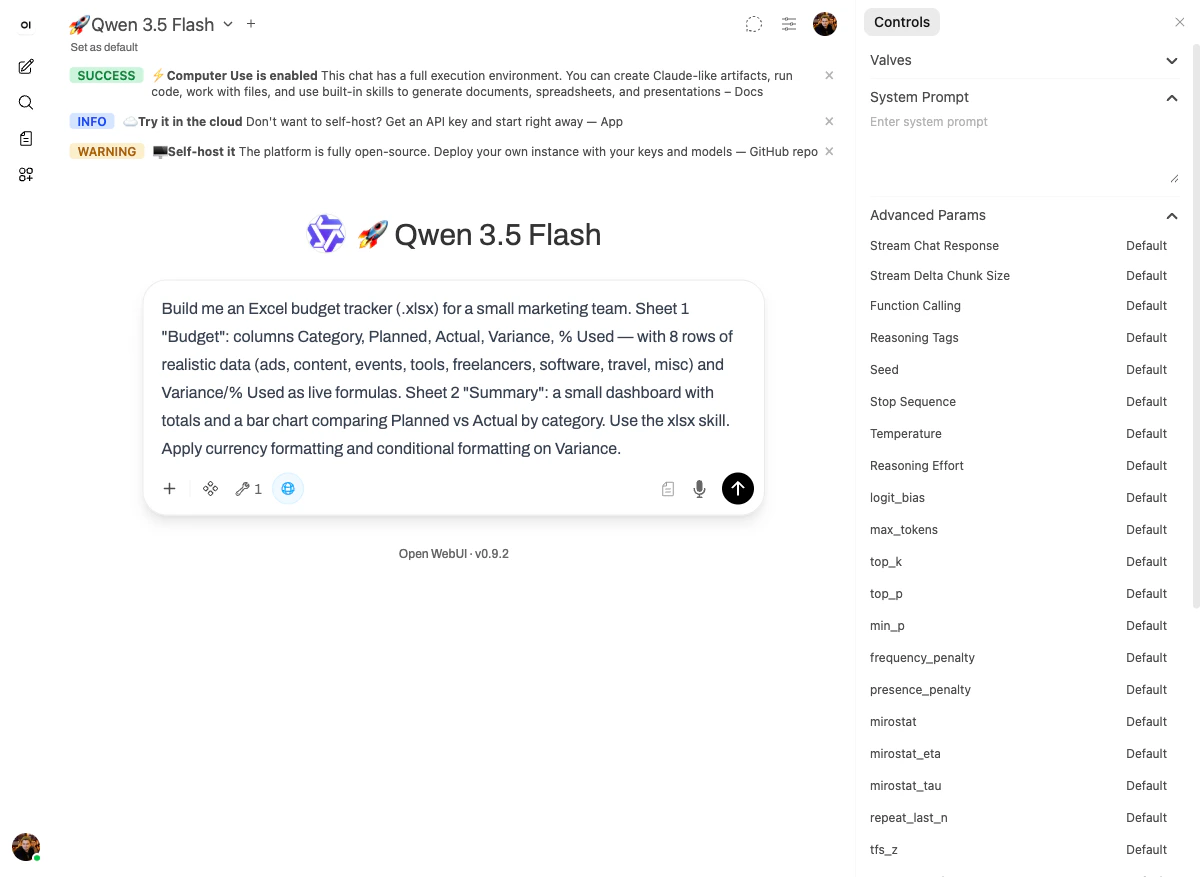
Build me an Excel budget tracker (.xlsx) for a small marketing team.
Sheet 1 "Budget": columns Category, Planned, Actual, Variance, % Used —
with 8 rows of realistic data (ads, content, events, tools, freelancers,
software, travel, misc) and Variance/% Used as live formulas.
Sheet 2 "Summary": a small dashboard with totals and a bar chart comparing
Planned vs Actual by category.
Use the xlsx skill. Apply currency formatting and conditional formatting on Variance.
```
 ## What happened
The [`xlsx` skill](/skills/reference#xlsx-excel-spreadsheets) wraps `openpyxl` plus a LibreOffice-based recalculation step. After generating the workbook, the model **runs `recalc.py` on it** to confirm every formula evaluates without `#REF!` or `#DIV/0!`. That validation step is the difference between "the model wrote a spreadsheet" and "the spreadsheet works."
The model's own confirmation:
> The recalculation script confirmed all 38 formulas work correctly with zero errors ✅
## The output
## What happened
The [`xlsx` skill](/skills/reference#xlsx-excel-spreadsheets) wraps `openpyxl` plus a LibreOffice-based recalculation step. After generating the workbook, the model **runs `recalc.py` on it** to confirm every formula evaluates without `#REF!` or `#DIV/0!`. That validation step is the difference between "the model wrote a spreadsheet" and "the spreadsheet works."
The model's own confirmation:
> The recalculation script confirmed all 38 formulas work correctly with zero errors ✅
## The output
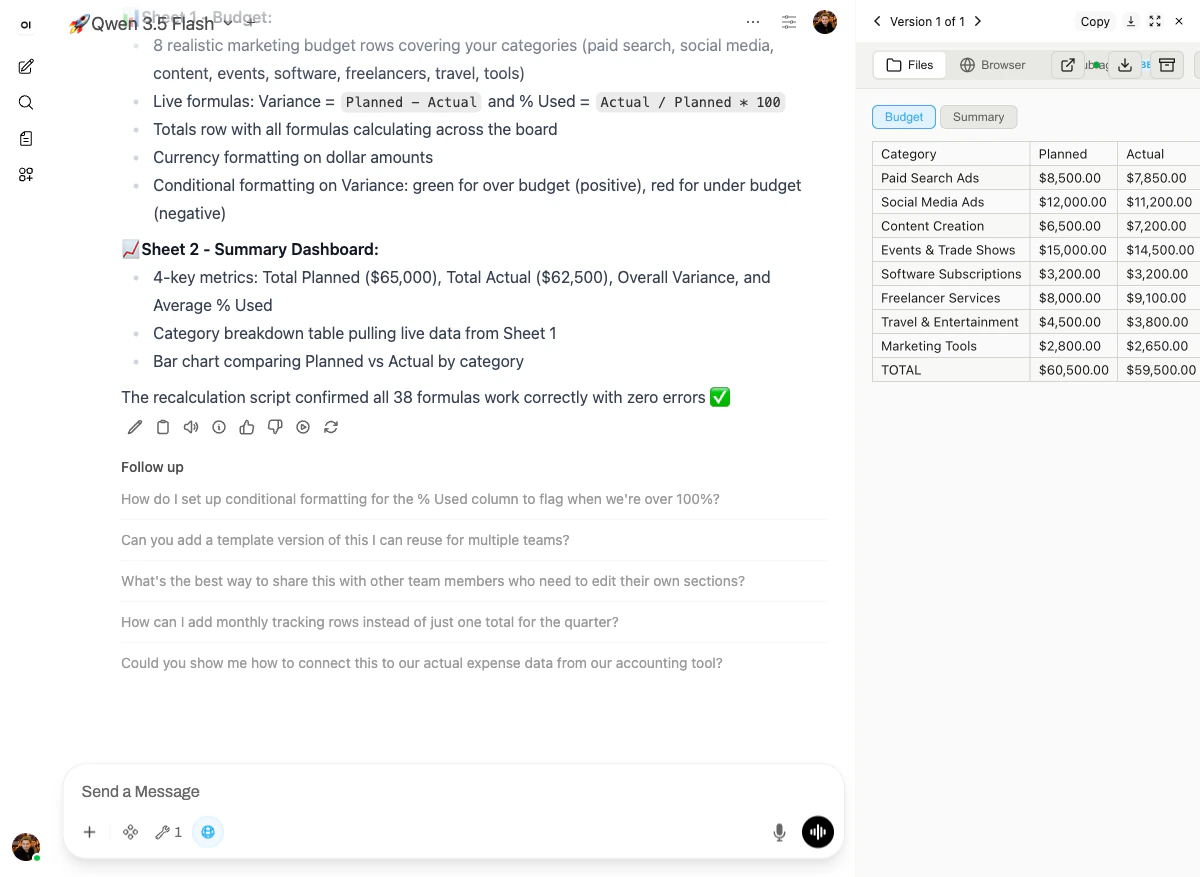 What you can see in the right-hand preview:
* **Sheet 1 "Budget"** with 8 categories and realistic values (Paid Search Ads $8,500 / $7,850 · Social Media Ads $12,000 / $11,200 · Events & Trade Shows $15,000 / $14,500 · …).
* A **TOTAL row** at the bottom totalling $60,500.00 / $59,500.00.
* A **Summary sheet tab** next to the Budget tab.
The reply itself spells out the structure:
* 8 realistic marketing budget rows covering paid search, social media, content, events, software, freelancers, travel, tools.
* Live formulas: `Variance = Planned − Actual` and `% Used = Actual / Planned * 100`.
* Totals row with all formulas calculating across the board.
* Currency formatting on dollar amounts.
* **Conditional formatting on Variance: green for over budget, red for under budget.**
* **Sheet 2 — Summary Dashboard:** four key metrics (Total Planned, Total Actual, Overall Variance, Average % Used) plus the Planned-vs-Actual bar chart.
## Why it works
Three things have to be true for a spreadsheet output to be useful:
1. **Formulas have to be live** — otherwise the user can't change a value and watch the totals update.
2. **The chart has to be a real chart object** — otherwise you can't restyle it or extend the data range.
3. **Conditional formatting has to survive the format** — otherwise the variance column is just plain text.
The `xlsx` skill handles all three, and the bundled `recalc.py` script catches formula errors before the file ever reaches the user.
Next: [Freelance invoice in PDF →](/demo-course/04-pdf)
What you can see in the right-hand preview:
* **Sheet 1 "Budget"** with 8 categories and realistic values (Paid Search Ads $8,500 / $7,850 · Social Media Ads $12,000 / $11,200 · Events & Trade Shows $15,000 / $14,500 · …).
* A **TOTAL row** at the bottom totalling $60,500.00 / $59,500.00.
* A **Summary sheet tab** next to the Budget tab.
The reply itself spells out the structure:
* 8 realistic marketing budget rows covering paid search, social media, content, events, software, freelancers, travel, tools.
* Live formulas: `Variance = Planned − Actual` and `% Used = Actual / Planned * 100`.
* Totals row with all formulas calculating across the board.
* Currency formatting on dollar amounts.
* **Conditional formatting on Variance: green for over budget, red for under budget.**
* **Sheet 2 — Summary Dashboard:** four key metrics (Total Planned, Total Actual, Overall Variance, Average % Used) plus the Planned-vs-Actual bar chart.
## Why it works
Three things have to be true for a spreadsheet output to be useful:
1. **Formulas have to be live** — otherwise the user can't change a value and watch the totals update.
2. **The chart has to be a real chart object** — otherwise you can't restyle it or extend the data range.
3. **Conditional formatting has to survive the format** — otherwise the variance column is just plain text.
The `xlsx` skill handles all three, and the bundled `recalc.py` script catches formula errors before the file ever reaches the user.
Next: [Freelance invoice in PDF →](/demo-course/04-pdf)